Back in the summer of 2012, Jamie and I developed the first Planet Kubb Scoresheet, we had just 1 competitive tournament under our belt and were walking into our first US Nationals. While we knew the rules of the game (this time!) and a primitive version of the Game Notation, we didn’t yet know what the important statistics were (sure, “wins” but those are still pretty scarce for us).
A year later, with the 2013 Nationals and a few more tournaments in the rearview mirror, Jamie and I were discussing the key metrics for a Kubb team as well as some revisions to the scoresheet. What numbers separate elite teams from backyard players? What numbers separate elite teams? How can a team measure improvement even if they’re not yet winning?
We identified 3 key metrics:
- Efficiency %: What percentage of the field kubbs are toppled with the first baton throw? (High numbers indicate a strong Inkastare/Blaster relationship)
- 0B@T# (Zero Base Kubbs at Throw Number): How many batons are needed to clear the 8m baseline? (Low numbers indicate how aggressively a team clears the field. 5 is the lowest possible number).
- Hit %: What percentage of the batons knock over something? (Elite teams are >50% ).
These 3 metrics effectively capture the significant elements of the game (inkast/blast, 8m, and overall accuracy). Each kubb team has a different mix of these skills. For example, here’s the numbers for 3 top teams from the 2013 Nationals Final rounds:
| Team | Eff % | 0B@T# | Hit % |
| Kubbiscles | 49 | 17 | 61 |
| King Pin | 51 | 18 | 52 |
| Team Knockerheads | 58 | 18 | 62 |
From this you can see 3 very different kinds of play.
The Kubbsicles get to 0 Baselines slightly faster on average than the other 2 teams and they’ve a very strong Hit %. Their lower efficiency suggests a great blaster isn’t required to become National champs. Contrast that with second place finisher King Pin, their lower Hit % indicates that blasting is what took them deep into the bracket. The Knockerhead’s numbers really speak to how successful they were at all the 2013 tournaments and how a team this strong can still have an off match.
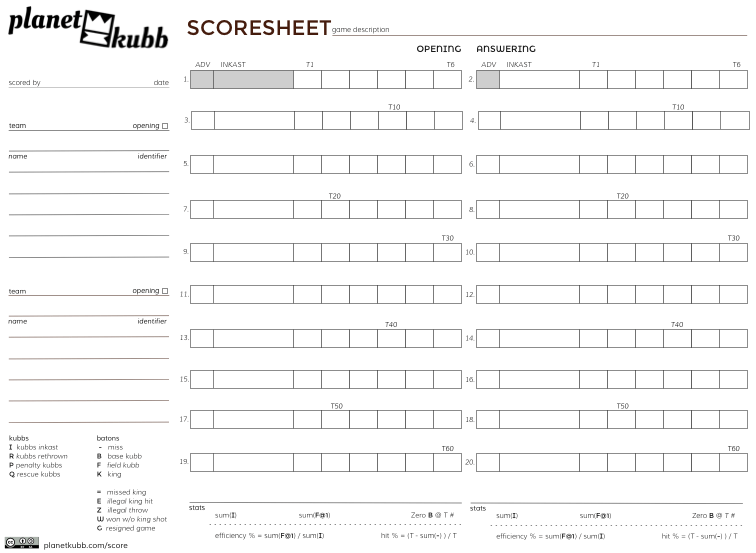
We’ve completely reworked the Planet Kubb Scoresheet (and turned it sideways!), moved team roster to it’s own section (which removes an always awkward start of match problem with who starts first), and added a section at the bottom to easily calculate these 3 metrics while on the pitch.
Earlier this week I field tested the Scoresheet+stats in a solitaire match. My performance in those 2 games:
| Team | Eff % | 0B@T# | Hit % |
| G1 | 33 | 26 | 68 |
| G2 | 58 | 62 |
Check out these PDFs to see the stats section in action; Garrick’s Field Test #1.pdf and Garrick’s Field Test #2.pdf.
From this you can see the side that cleared baselines won despite not being as efficient at clearing field kubbs. Calculating theses stats provides a sense of completion lacking from the previous 9 versions of the Scoresheets. I’ve always discouraged scoring in practice matches. With this new Scoresheet, I’ll likely change my position.
Hi Garrick, very interesting development on kubbs’ metrics. I was thinking about your 0B@T# metric. You say that this metric is useful to determine which team has a strong 8m, but this looks to me partially incorrect because it involves in the majority of cases, tosses at fields’ kubbs just 4 meter away. Shouldn’t be more correct looking for a ratio similar to hit% related only to Base kubbs?
Albert,
Thanks for the question. The lowest possible 0B@T# is 5 (0 field kubbs). So, yes, all numbers above 5 contain both misses and field kubb hits. I’ve updated the post to reflect this distinction.